
Tampere University’s annual review 2024
At the end of 2024, approximately 23,200 students from 107 nationalities were working towards a degree at Tampere University.
We employed around 4,200 people representing 82 nationalities.
We conferred more than 4,800 degrees in ten fields of education in 2024.
We are located in Tampere, Seinäjoki and Pori.


Highlights from 2024
- We saw a continued rise in the number of degrees awarded, along with an increase in degrees completed by international students.
- We were selected to participate in all the main instruments of the European Union’s Chips Act and secured €40 million to establish a System-in-Package Fabrication (SiPFAB) pilot line.
- We received €27 million in funding from the nationwide doctoral education pilot, enabling us to hire 106 doctoral researchers for three years.
- Notable changes were made to senior leadership roles as two of our vice presidents and all seven deans started their new terms on 1 January 2024.
Education
Tampere University stands out as one of the most multidisciplinary universities in Finland, with approximately 23,200 students pursuing their degrees with us each year. Our key areas of focus are technology, health and society, and almost all internationally recognised fields of education are represented at our University. We educate experts in ten fields of education.
We also offer doctoral programmes, specialty training, Open University courses, continuing education and professional development opportunities.
Number of students and international student ratio, FTE
| Level of study | 2022 | 2023 | 2024 |
|---|---|---|---|
| Bachelor's programmes - International students | 8,515 1.7% | 8,639 2.0% | 8,837 2.7% |
| Master's programmes - International students | 6,766 12.3% | 7,070 14.3% | 7,602 14.2% |
| Doctoral programmes - International students | 1,244 24.7% | 1,277 25.9% | 1,287 25.0% |
| Total - International students | 16,524 7.8% | 16,986 8.9% | 17,726 9.3% |
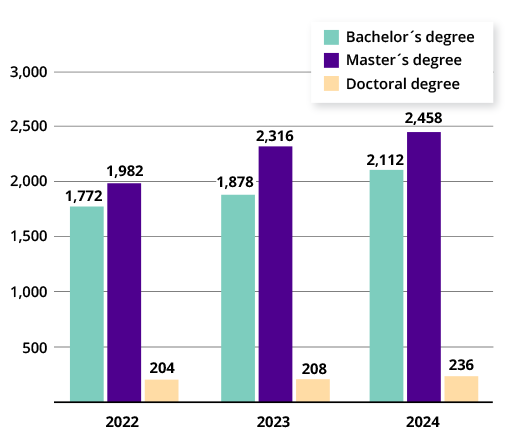
Number of degrees

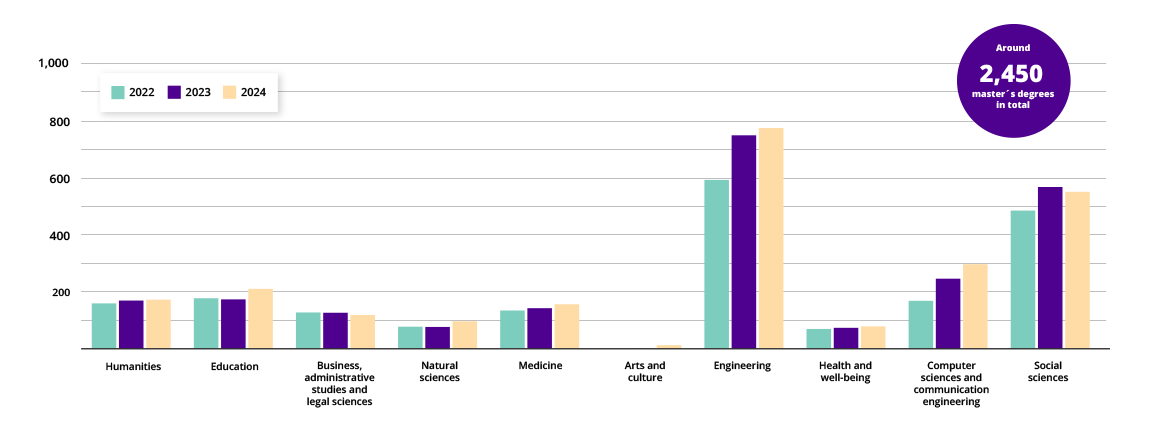
Number of master’s degrees by field of study
Research
We conduct wide-ranging research across disciplinary boundaries, with research in the fields of technology, health and society being a particular strength. We are committed to responsible research practices and actively promote open science. Our Centres of Excellence explore a diverse range of topics, from body-on-chip research to game cultures.
Centres of Excellence
Centres of Excellence (CoE) are communities comprising one or more research groups that are recognised for their research excellence and receive funding from the Research Council of Finland. CoEs conduct cutting-edge research and provide training to researchers.
We coordinate four CoEs:
- HEX – Centre of Excellence in the History of Experiences (2018–2025)
- CoEBoC – Centre of Excellence in Body on-Chip Research (2018–2025)
- Centre of Excellence in Game Culture Studies (2018–2025)
- FIT – Centre of Excellence in Tax Systems Research (2022–2029)
We are a partner in six CoEs:
- LIBER – Centre of Excellence in Life Inspired Hybrid Materials (2022–2029)
- CoE AgeCare – Centre of Excellence in Research on Ageing and Care (2018–2025)
- Centre of Excellence in Inverse Modelling and Imaging (2018–2025)
- Centre of Excellence in Tumour Genetics Research (2018–2025)
- HiECSs – Centre of Excellence in High-Speed Electromechanical Energy Conversion Systems (2022–2029)
- VILMA – Virtual Laboratory for Molecular-Level Atmospheric Transformations (2022–2029)
Peer-reviewed scientific publications
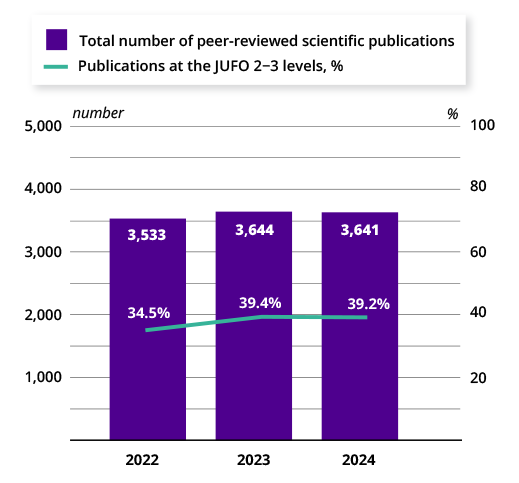
Key figures for peer-reviewed scientific publications
| Share | 2022 | 2023 | 2024 |
|---|---|---|---|
| Publications co-authored with internal partners | 8.4% | 9.8% | 8.4% |
| Publications co-authored with international partners | 43.2% | 44.0% | 46.1% |
| Publications co-authored with Finnish partners | 44.9% | 40.2% | 42.5% |
| Publications authored with company partners | 12.3% | 11.9% | 13.0% |
| English-language publications | 88.3% | 89.3% | 88.9% |
| Finnish-language publications | 10.8% | 10.0% | 10.1% |
| Open-access publications | 83.0% | 84.1% | 83.4% |
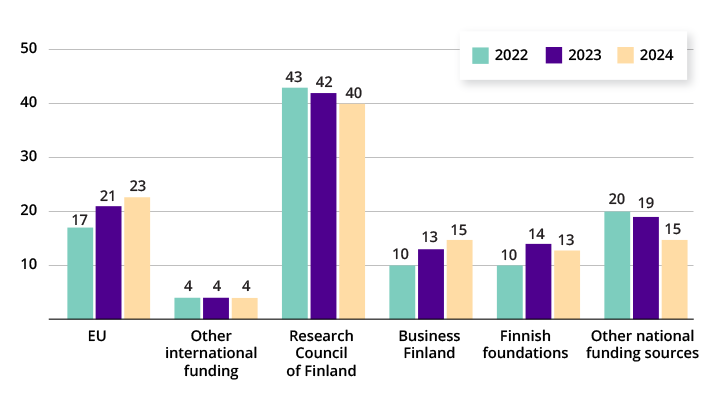
Sources of competitive research funding, M€

Societal interaction
We actively engage with the wider society. We maintain a broad range of partnerships with the private, public and third sectors in Finland and beyond. We offer diverse collaboration opportunities in research, education, development and innovation.
Our specialists participate in numerous public policy processes, contribute to the preparation of national recommendations and engage in public debate.
Number of innovation activities
| Number | 2022 | 2023 | 2024 |
|---|---|---|---|
| Invention disclosures | 46 | 33 | 54 |
| Filed parent patent applications | 2 | 6 | 7 |
| Spin-off companies | 2 | 3 | 3 |
Continuing education
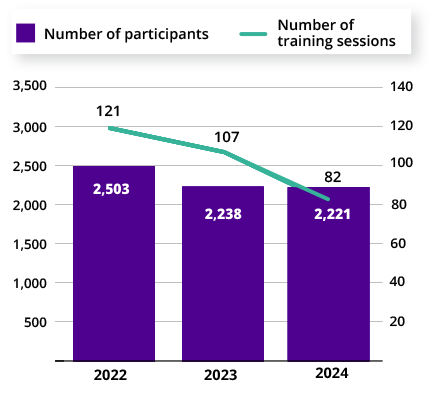
Our staff
We employ around 4,200 staff members. We have more than 3,000 employees working in teaching and research, approximately 100 working in our teacher training school and almost 1,000 members of other staff.
Staff numbers by staff group
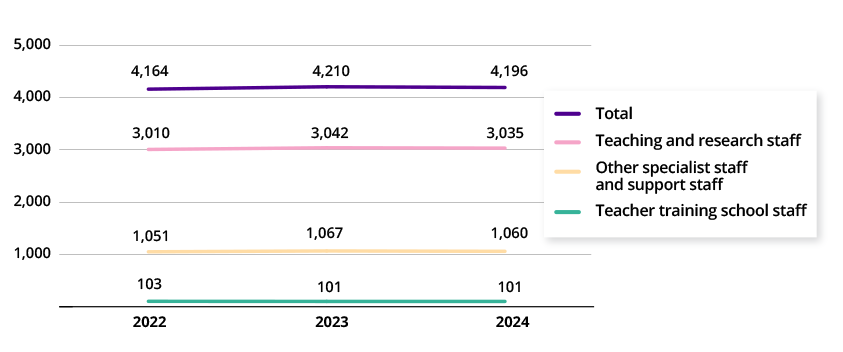
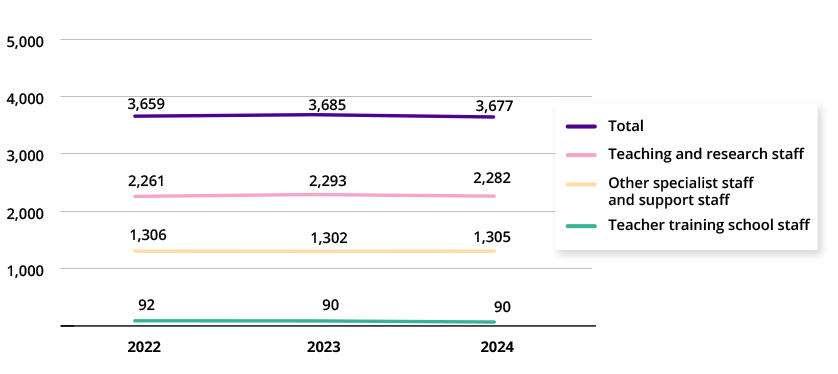
Person-years
| Staff group | 2022 | 2023 | 2024 |
|---|---|---|---|
| Teaching and research staff | 2,261 | 2,293 | 2,282 |
| - Research career level 1 | 794 | 824 | 851 |
| - Research career level 2 | 603 | 591 | 576 |
| - Research career level 3 | 518 | 538 | 524 |
| - Research career level 4 | 262 | 264 | 259 |
| - Hourly paid teachers | 84 | 75 | 72 |
| Other specialist staff and support staff | 1,306 | 1,302 | 1,305 |
| Teacher training school staff | 92 | 90 | 90 |
| Total person-years | 3,659 | 3,685 | 3,677 |
Person-years by staff group
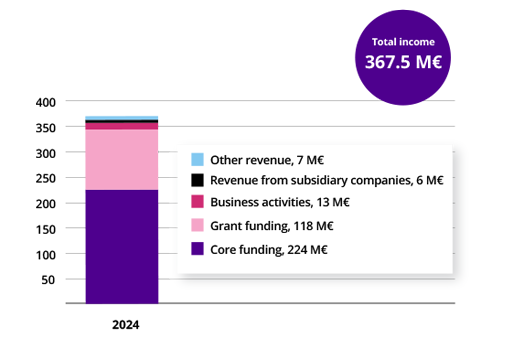
Finances and facilities
Income 2024, M€
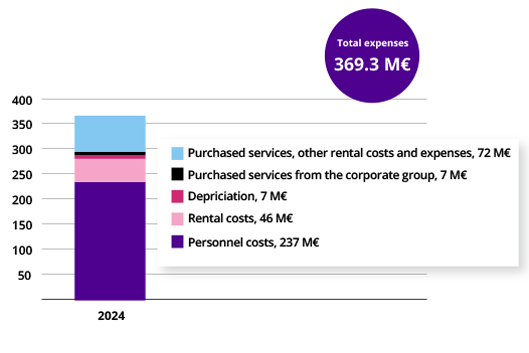
Expenses 2024, M€
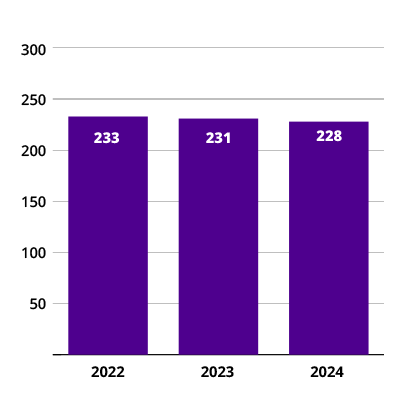
Rented floor space, 1,000 square metres
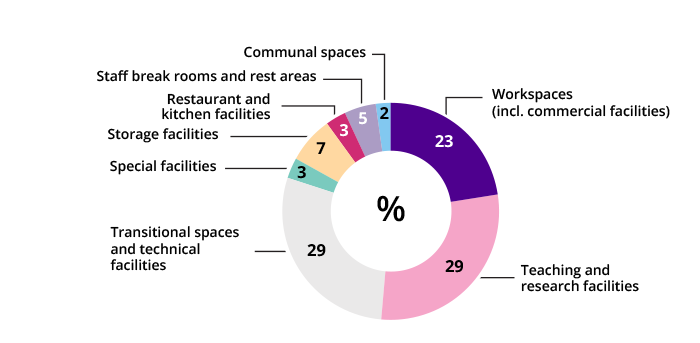
Distribution of floor space by space type 2024

Sustainable development
We are building an operational culture that promotes sustainability in our operations, teaching, research, development and innovation activities and our interactions with society. Sustainable development principles are integrated into our degree programmes. We adhere to the UN Sustainable Development Goals. As a University, we are working towards achieving carbon neutrality by 2030.
Read more about our financial results
Press release announcing our financial results
Previous annual reports and financial statements
Contact us
If you have questions about the Annual Review, please contact our Communications unit at viestinta.tau [at] tuni.fi.