We are developing a software for overlaying and analyzing images, creating visualizations. The software is capable of processing generic image formats. It is specifically developed for correlative microscopy but can be used for many applications. Image alignment can be done easily and accurately by hand or by automatic tools, and further enhanced by various options. The software provides the user with creative ways of interacting with the data, and specific functionalities can be utilized to extract hidden information from the existing data.
The goal for the program is to be as accessible and versatile as possible, and not constrained by the type of the images. Industry standard software can often have a steep learning curve and high maintenance costs, and we aim to provide an intuitive and easy-to-use option that competes with existing programs. The project is work-in-progress, but it is already a useful tool in laboratory settings.
If you are interested in the project or want to test the software, please don’t hesitate to contact us.
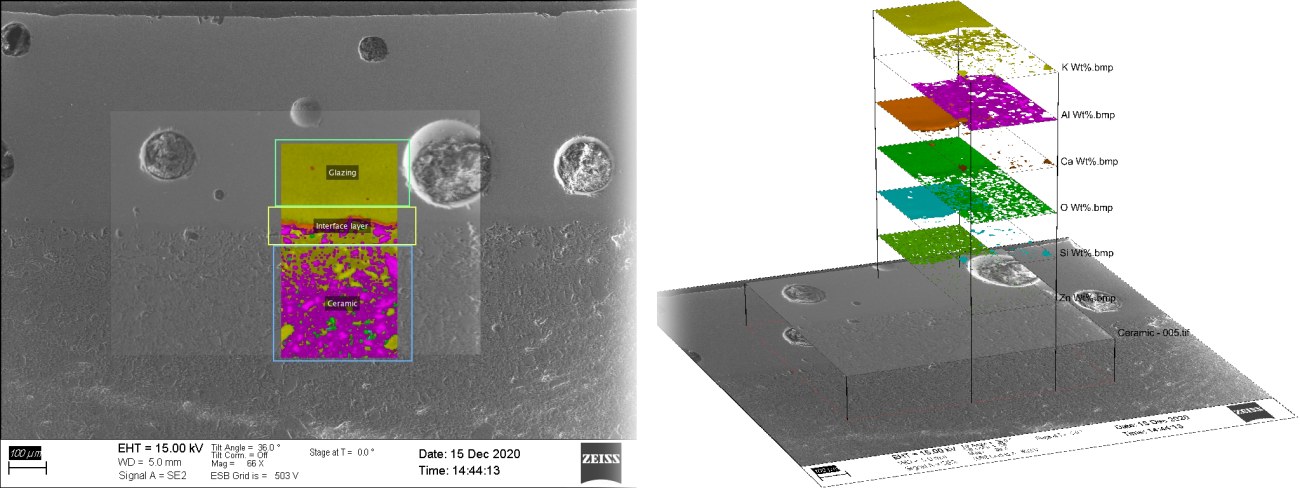
Several SEM and EDS microscope images of a Chai kiln ceramic piece overlayed in the software displaying elemental configurations of regions.
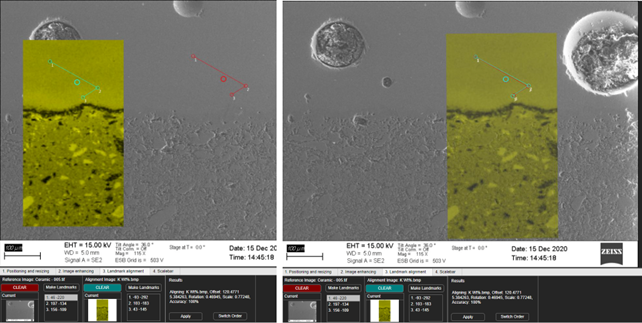
Landmark alignment
Landmark alignment tool minimizes time spent aligning images manually, since it aligns images automatically with a specified set of landmarks. In this example, an EDS image is aligned with a SEM image with three distinct points visible in both images.
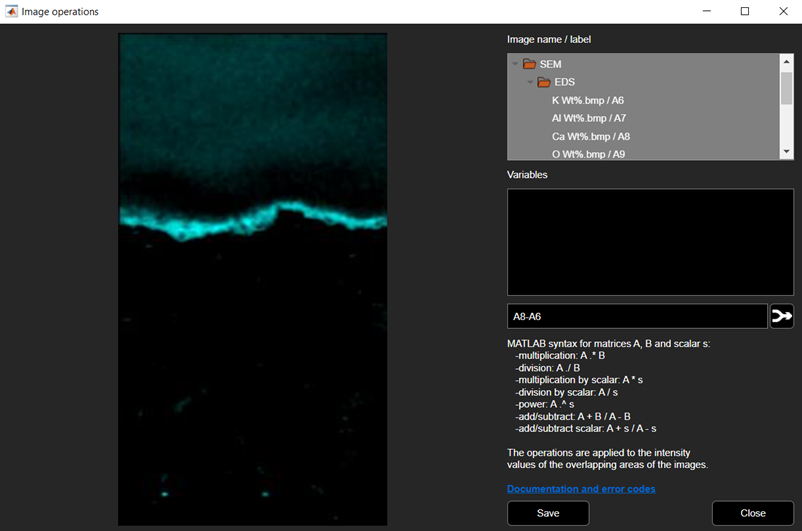
Image operations
The Image operations tool can be used to apply mathematical operations to images. In this example, the elemental map of potassium is subtracted from the corresponding map of calcium, revealing a layer of anorthite.
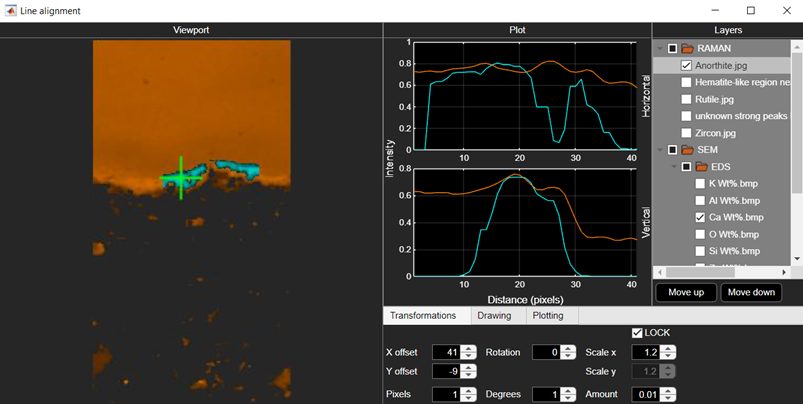
Line alignment tool
The Line alignment tool allows the user to accurately align multiple images based on intensity profiles of lines of a cross that the user can draw to the images. In this example, a RAMAN image of anorthite is aligned with an EDS image using the intensity curves. A similarity of intensities can be viewed on the vertical intensity axis. This would be challenging to do by eye.
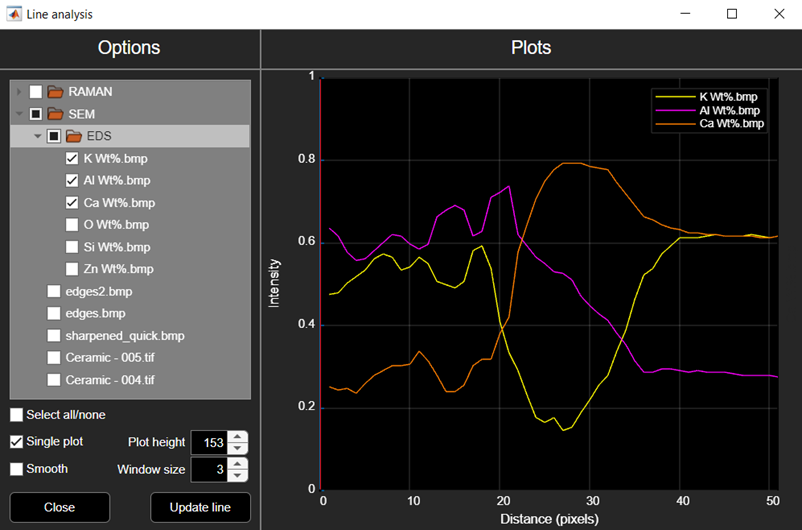
Line analysis
The Line analysis tool allows the user to create intensity curves between two points of multiple images. In this example, a line analysis spanning a heterogeneous area, interface area and homogeneous area is drawn. The three distinct areas are visible in the curves from left to right. This allows the user to analyze the aligned images between areas, and align images more accurately.
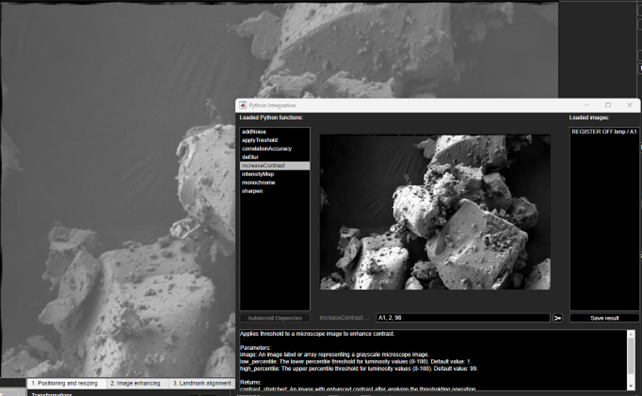
Python integration
The Python integration tool allows the user to seamlessly use premade or their own python functions within the software with minimal work. In this example, a contrast enhancement is applied to a SEM image.

 Turkka Salminen
 Lucio Azzari